
In your Customer Area, you can view your sales history and payout batches in the Sales to payouts dashboard.
Requirements
Before you begin, take into account the following requirements and preparations.
| Requirement | Description |
|---|---|
| Integration type | You must be onboarded as a franchisee by your franchisor. For more information, see Onboarding. |
| Customer Area roles | To view the Sales to payouts dashboard, you must have one of the following roles: Manage key financial tasks Generate key financial reports |
View your dashboard
To open the dashboard:
- Log in to your Customer Area.
- Select Balances > Sales to payouts.
- If prompted, select a merchant account.
- Select a date range.
- To download the data in
.csvformat, select Export.
The dashboard has two tabs:
Sales
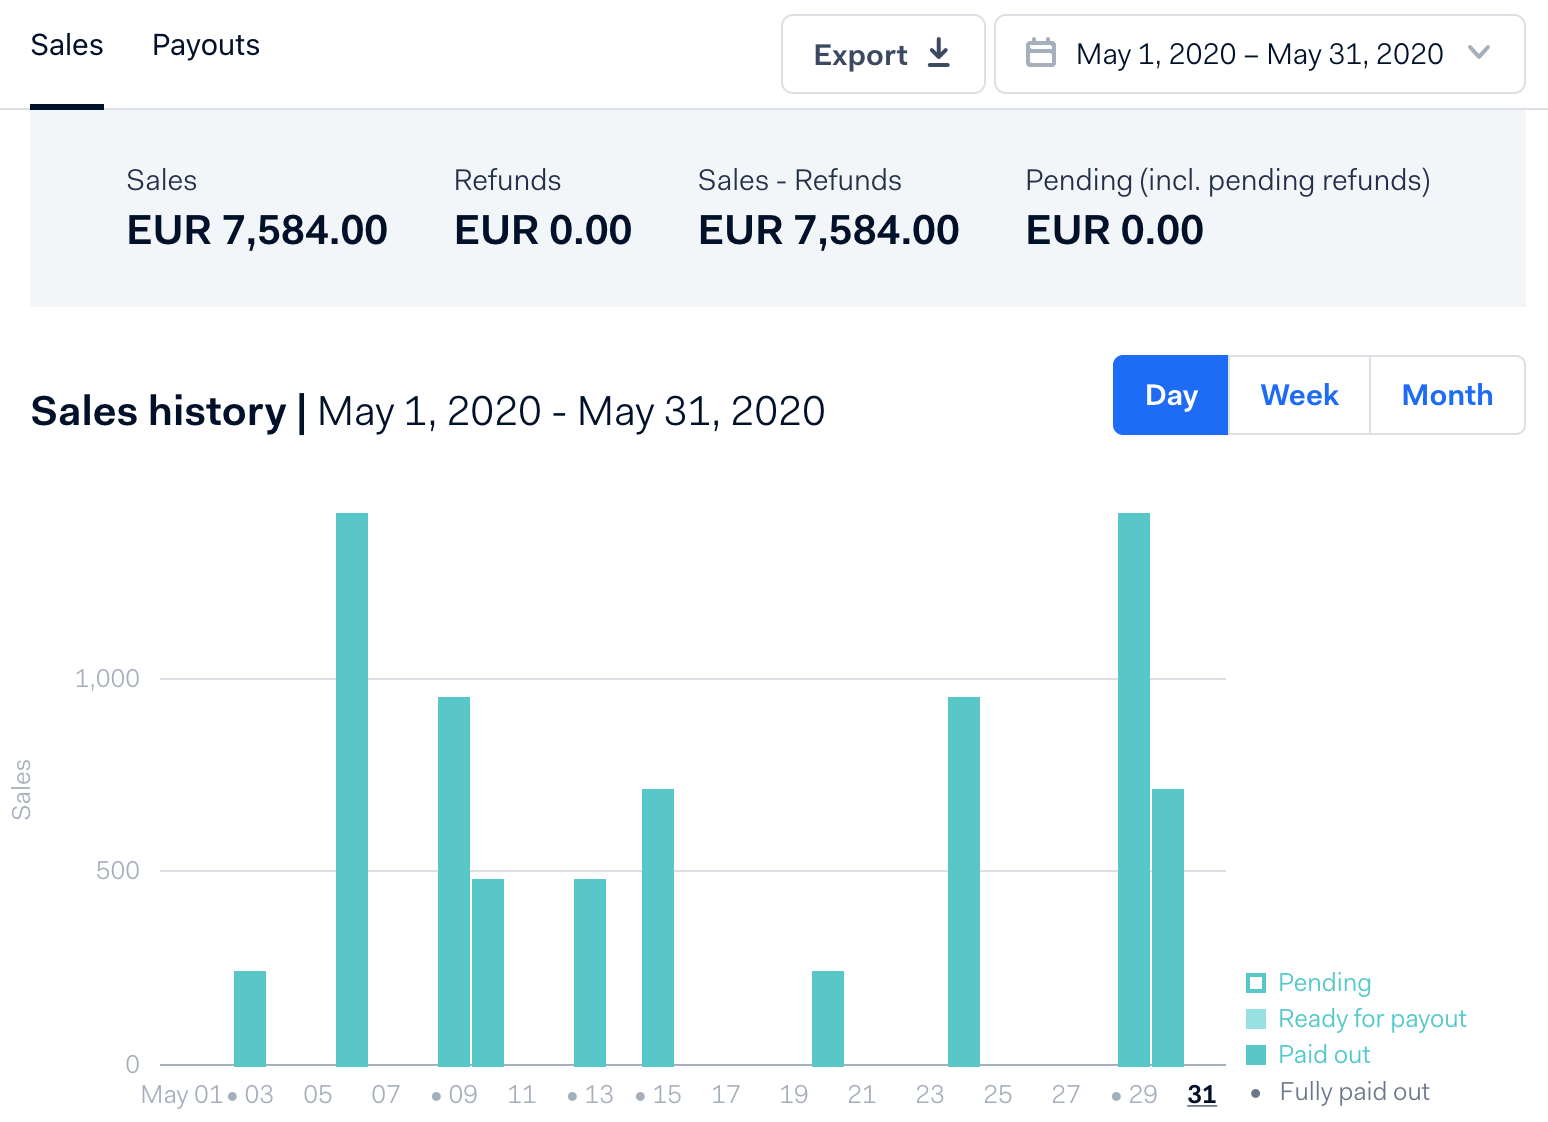
The Sales tab shows the following totals for the selected date range:
- Sales: The total amount of transactions with status SentForSettle or Settled.
- Refunds: The total amount of transactions with status SentForRefund or Refunded.
- Sales - Refunds: The total amount of transactions with status SentForSettle or Settled, minus the total amount of transactions with status SentForRefund or Refunded.
- Pending (incl. pending refunds): The total amount of transactions with status SentForSettle or SentForRefund.
You can choose the time interval shown by selecting Day, Week, or Month.
The following screenshot shows the Sales tab.
Sales history
The Sales history chart shows the total sales amount for each increment of time in the selected date range.
Each bar on the chart, depending on its color, indicates the amount that is Pending, Ready for payout, or Paid out. The chart key shows the colors and their corresponding statuses.
Refunds history
The Refunds history chart shows the total refunds amount for each increment of time in the selected date range.
Each bar on the chart, depending on its color, indicates the amount that is Pending, Refunded, Ready for payout, or Refunded, paid out. The chart key shows the colors and their corresponding statuses.
Batch details
When you select the bar of a specific day, week, or month, you see the details.
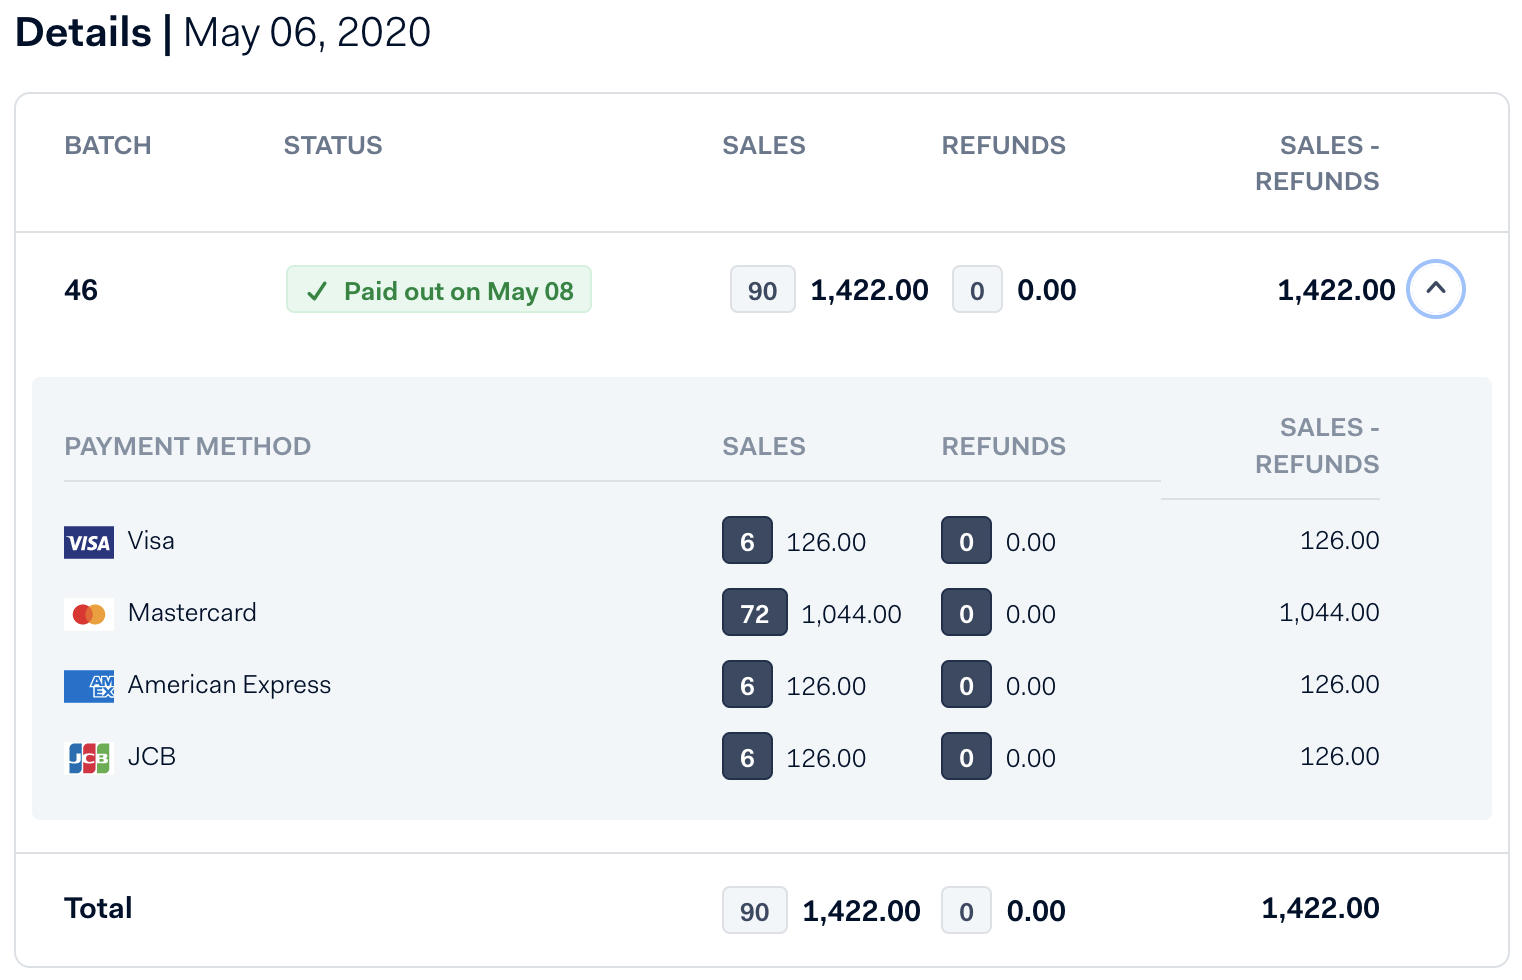
In the example screenshot, the May 06 bar from the chart is selected. The Details section shows the following amounts for that day's batch:
- BATCH: The batch number that includes the day's sales.
- STATUS: Whether the batch has been paid out.
- SALES: The total sales amount.
- SALES - REFUNDS: The sales amount minus the refunds amount.
Expand the details of a batch to see a breakdown of sales and refunds by payment method.
The following screenshot shows an example of the details for a selected day.
Payouts
The Payouts tab shows the following totals:
- Sales: The total amount of transactions with status Settled.
- Refunds: The total amount of transactions with status Refunded.
- Cost of transactions: The total costs for payment processing.
- Adjustments: The total cost of adjustments. For example, chargebacks, deposit corrections, invoice deductions, and balance transfers.
- Payout: The amount that has been paid out to your bank account.
You can choose the increment of time represented by selecting Day, Week, or Month.
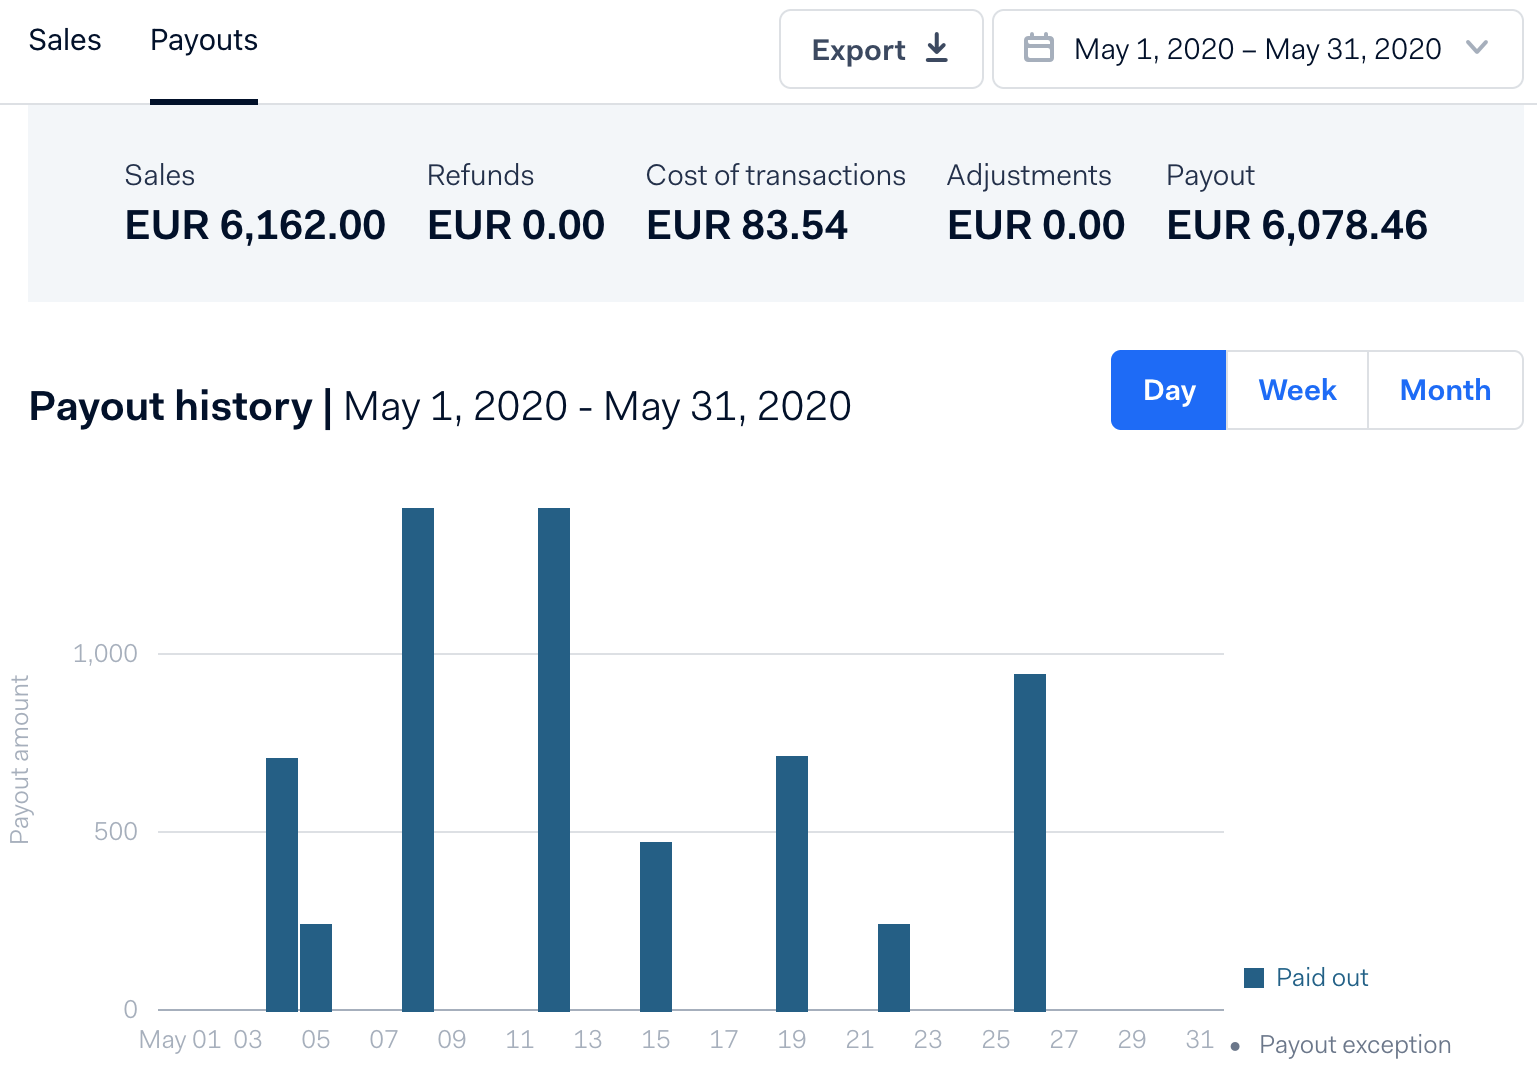
The following screenshot shows the Payouts tab.
Payout history
The Payout history chart shows the total payout amount for each increment of time in the selected date range.
Each bar on the chart indicates the amount that was paid out.
Payout details
When you select the bar of a specific day, week, or month, you see the details.
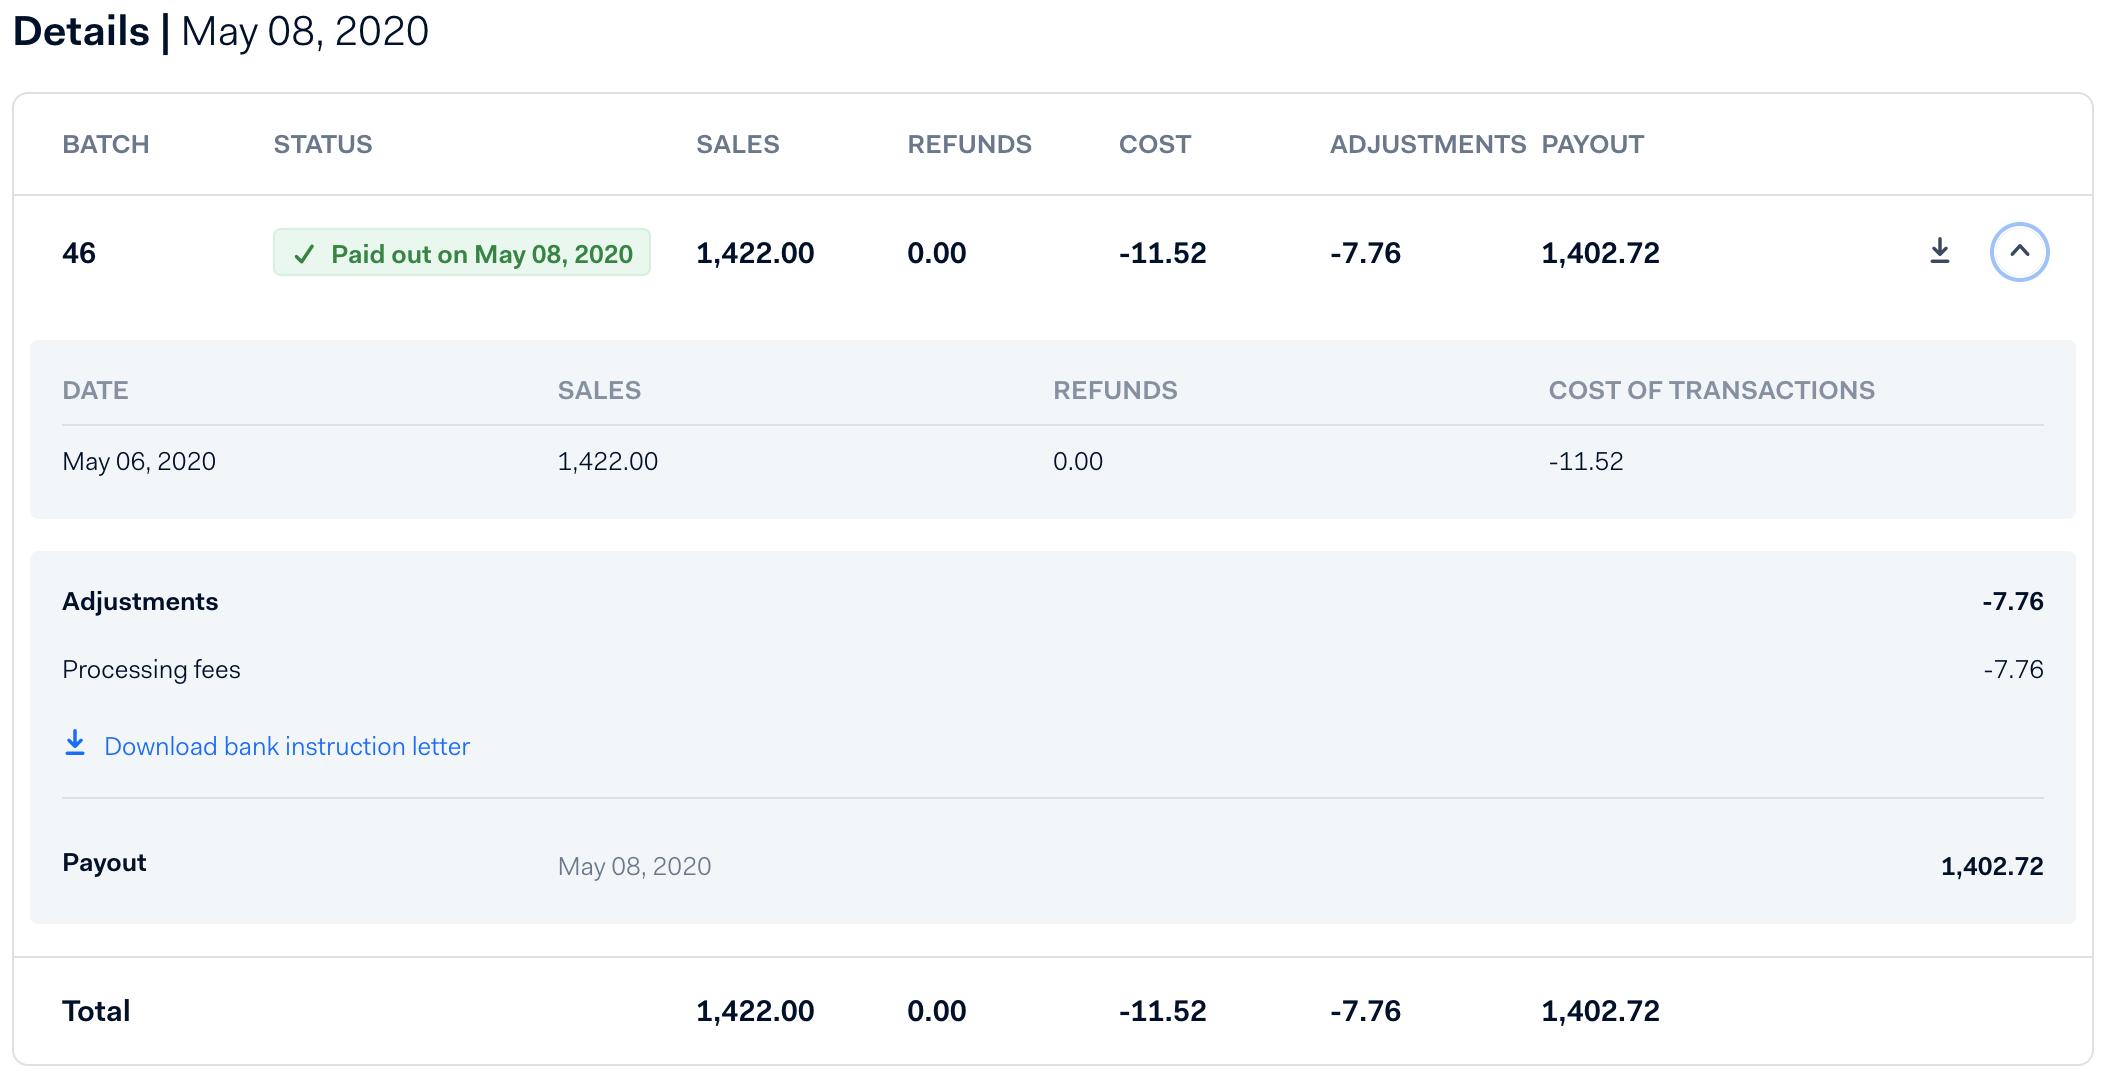
The Details section shows the following amounts for the batch paid out on that day:
- BATCH: The batch number of the payout.
- STATUS: Whether the batch has been paid out.
- SALES: The total sales amount.
- REFUNDS: The total refunds amount.
- COST: The total transaction costs amount.
- ADJUSTMENTS: The total adjustments, such as chargebacks, deposit corrections, invoice deductions, and balance transfers.
- PAYOUT: The payout amount.
Expand the details of the batch to see a breakdown of the adjustment amounts. To download the details of a batch in .csv format, select the download icon in the row of the batch.
The following screenshot shows an example of the details for a selected day.
Validate payouts against sales
To validate funds received in your bank account against the day of sale, use the aggregate settlement details report.
This report contains an overview of funds settled to your bank account in a certain period. The report summarizes payouts by store, payment method, the day of sale, and settlement batch.
The aggregate settlement details report does not equal the sales made in the month. To review the sales made and the payouts for these sales, adjust your report to:
- Align with your payout delay, for example two business days.
- Exclude payouts for sales made in the previous month, if any.
- Include payouts from the next month that relate to sales in the current month.
Example
For March 2026 with a two-business-day payout delay, the edge cases at the start and end of the month are:
| Sales date | Day | Payout date | Action |
|---|---|---|---|
| February 26 | Thursday | March 2 | Exclude — February sale, paid in March |
| February 27 | Friday | March 3 | Exclude — February sale, paid in March |
| February 28 | Saturday | March 3 | Exclude — February sale, paid in March |
| March 30 | Monday | April 1 | Include — March sale, paid in April |
| March 31 | Tuesday | April 2 | Include — March sale, paid in April |
Your reconciliation period covers sales from February 26 to March 31, but payouts from March 2 to April 2.