We provide the following insights dashboards in your Customer Area:
These dashboards are based on aggregated data from payments made through your company and merchant accounts.
Requirements
| Requirement | Description |
|---|---|
| Integration type | Omnichannel integration with multiple sales channels. |
| Customer Area roles | Make sure that you have the following role(s):
|
| Limitations | Starting January 12, 2026, the Omnichannel shoppers, Shopper origin and Performance comparison dashboards will be permanently shut down because we are evolving our data products at Adyen. If you have any questions, reach out to your Adyen contact. |
View the dashboards
To view the insights dashboards:
- Log in to your live Customer Area.
- Under Insights select the dashboard you want to view.
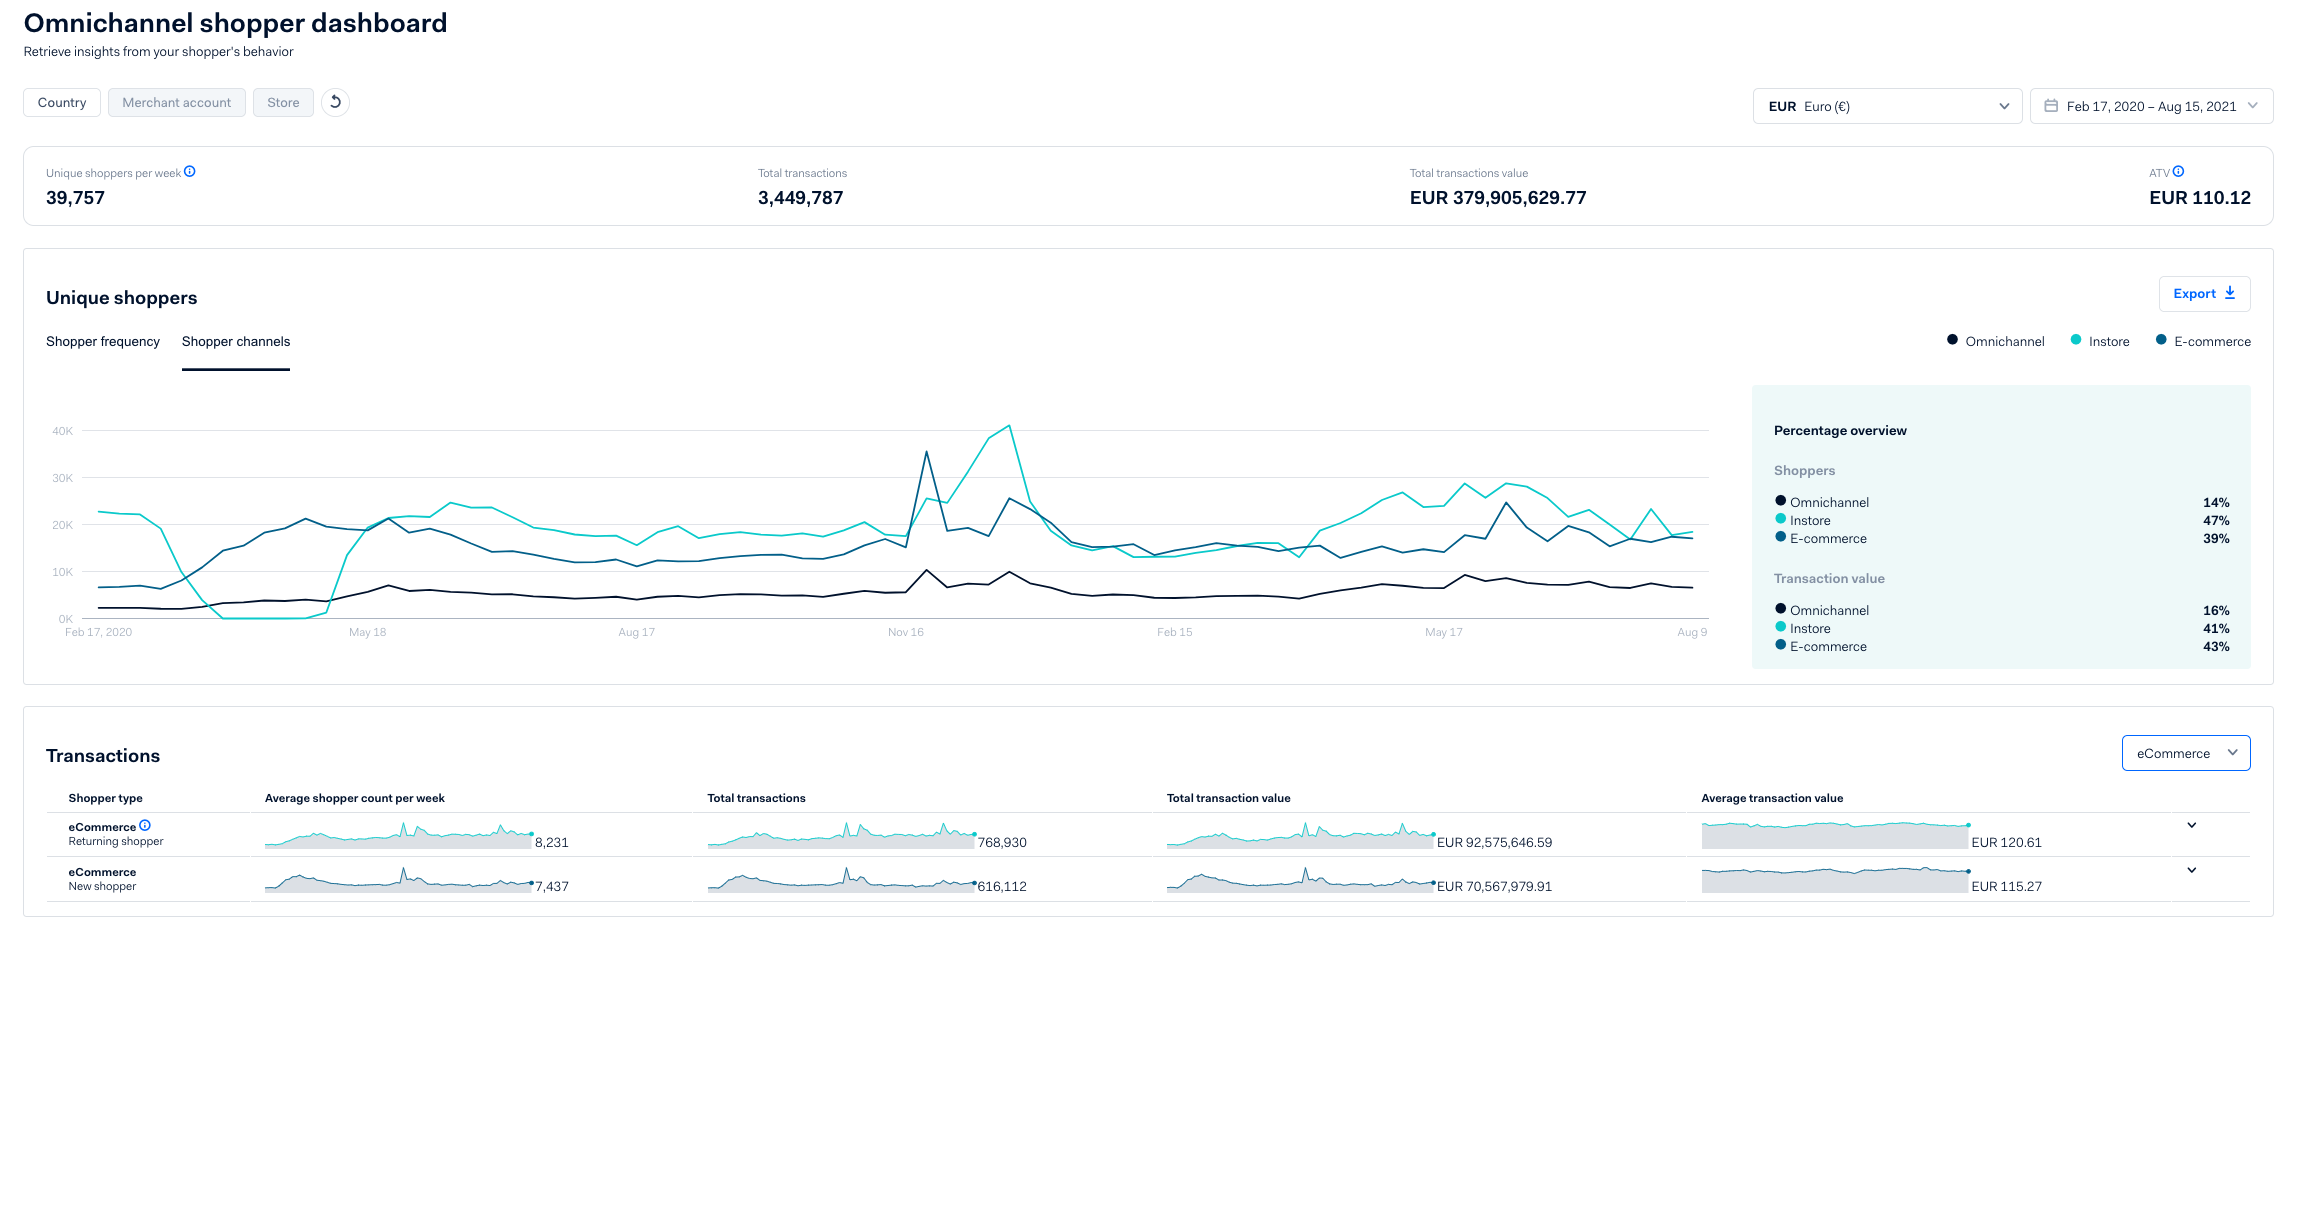
Omnichannel shoppers dashboard
The Omnichannel shoppers dashboard shows the following data at the company or country/region level in a given period:
- Number of unique shoppers per channel: in-store, e-commerce, and omnichannel shoppers.
- Total number of transactions.
- Total and average transaction value.
- Number and value of transactions for returning shoppers and new shoppers, per channel.
Starting January 12, 2026, the Omnichannel shoppers dashboard will be permanently shut down. If you have any questions, reach out to your Adyen contact.
Click the image to enlarge it.
Transaction values are shown in EUR. When you select a different currency, we use the average currency conversion rate of the given period. As a result, converted transaction values are an approximation of the actual turnover in that currency.
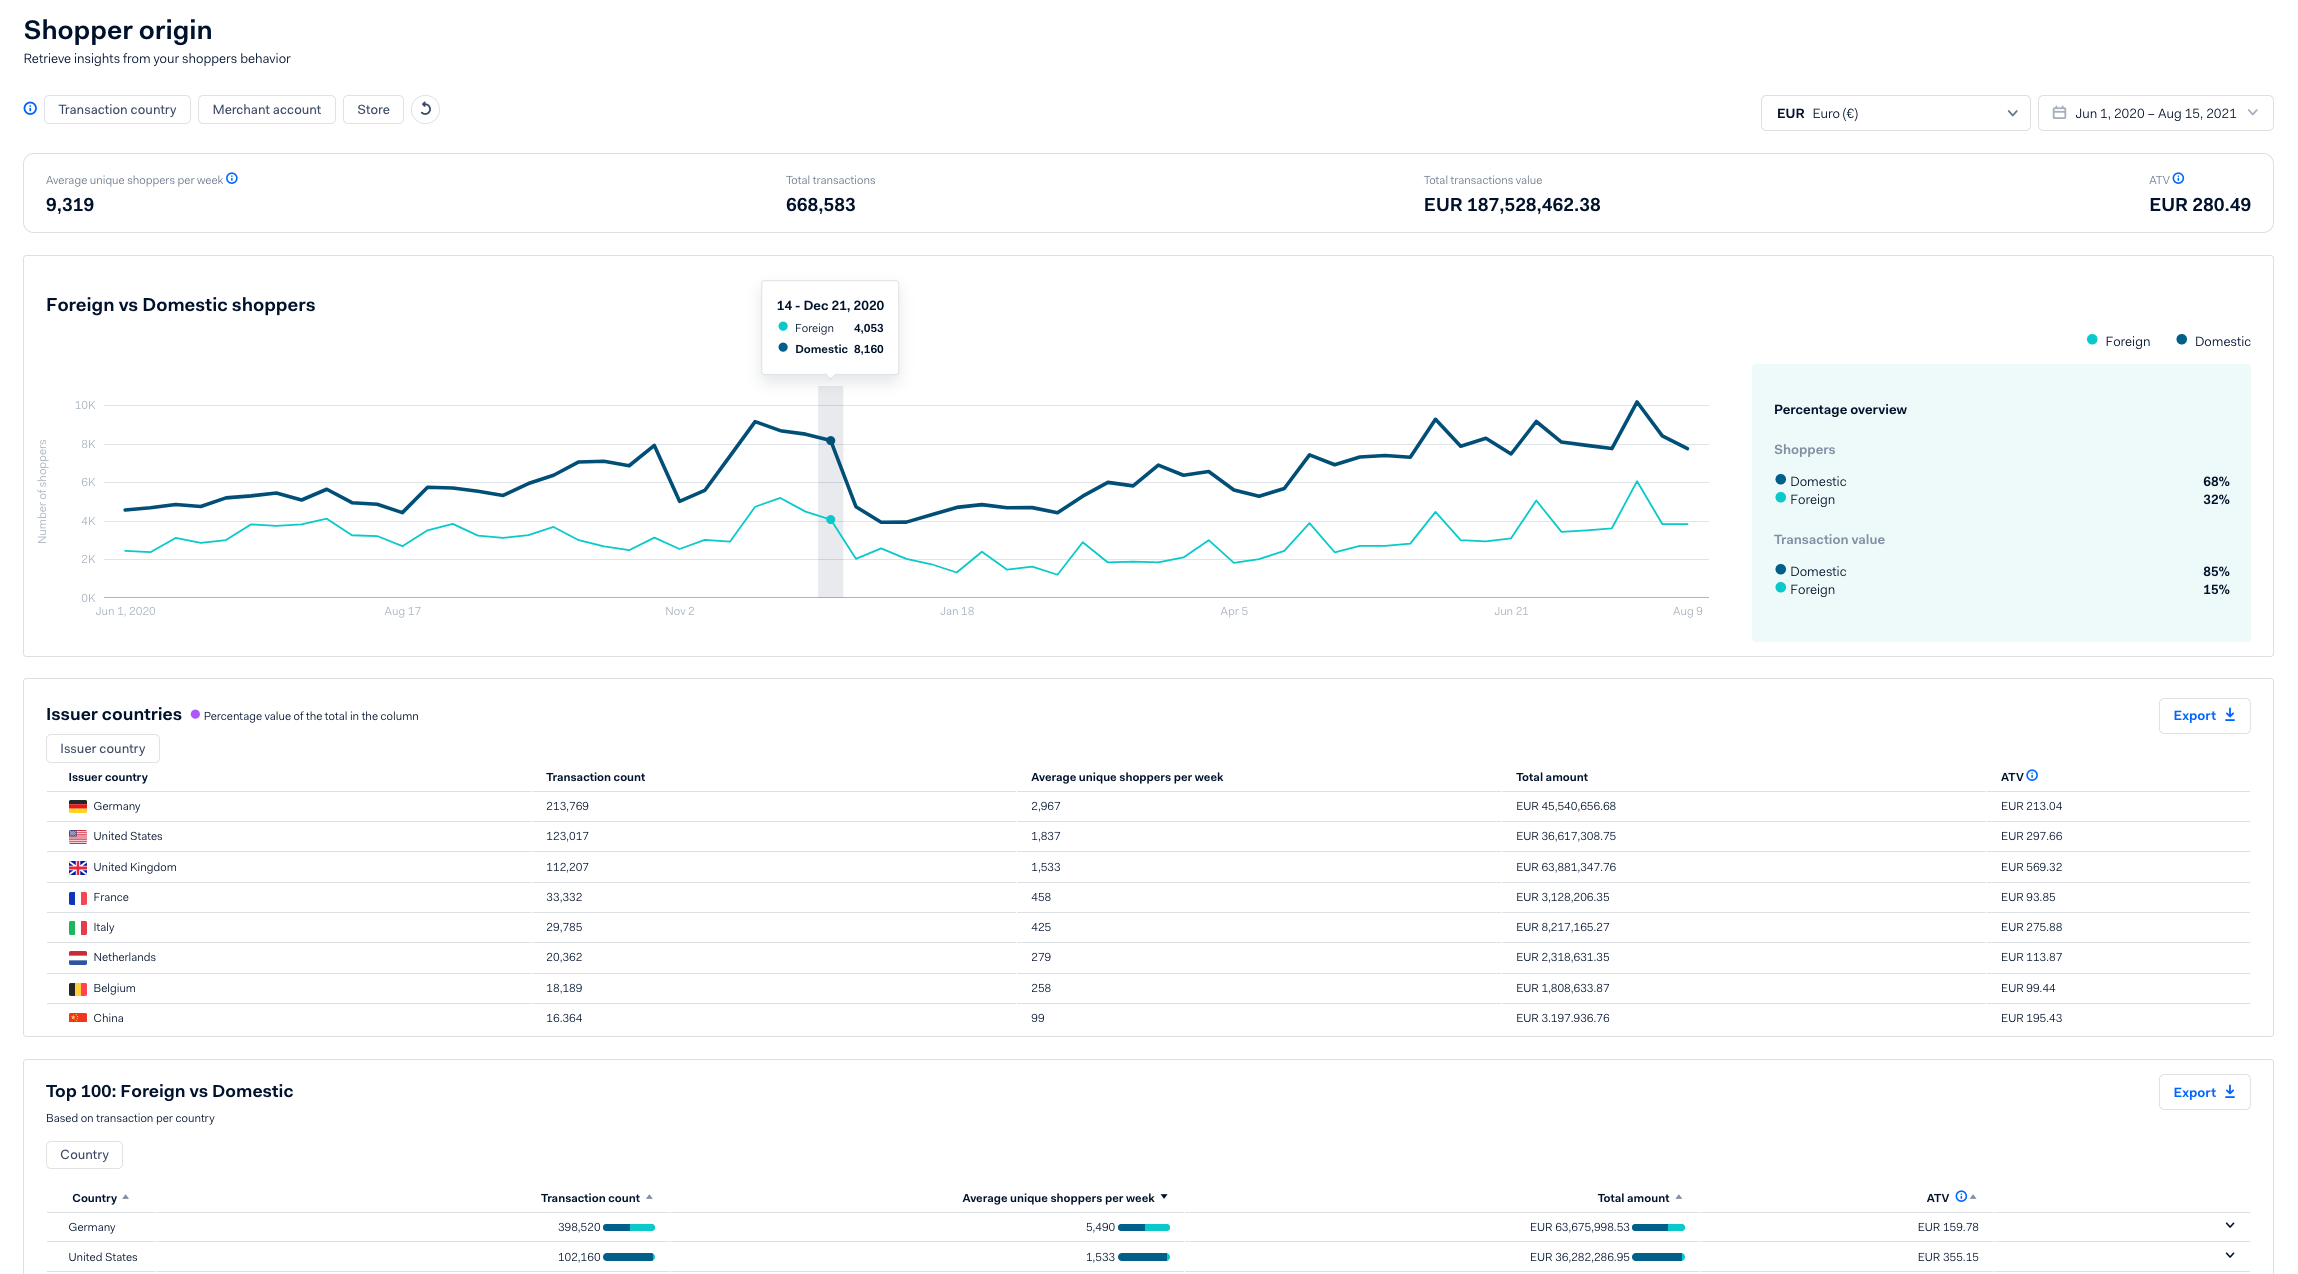
Shopper origin dashboard
You can filter the Shopper origin dashboard on country/region, merchant account, or store. It shows where your shoppers came from in a given period.
Starting January 12, 2026, the Shopper origin dashboard will be permanently shut down. If you have any questions, reach out to your Adyen contact.
Click the image to enlarge it.
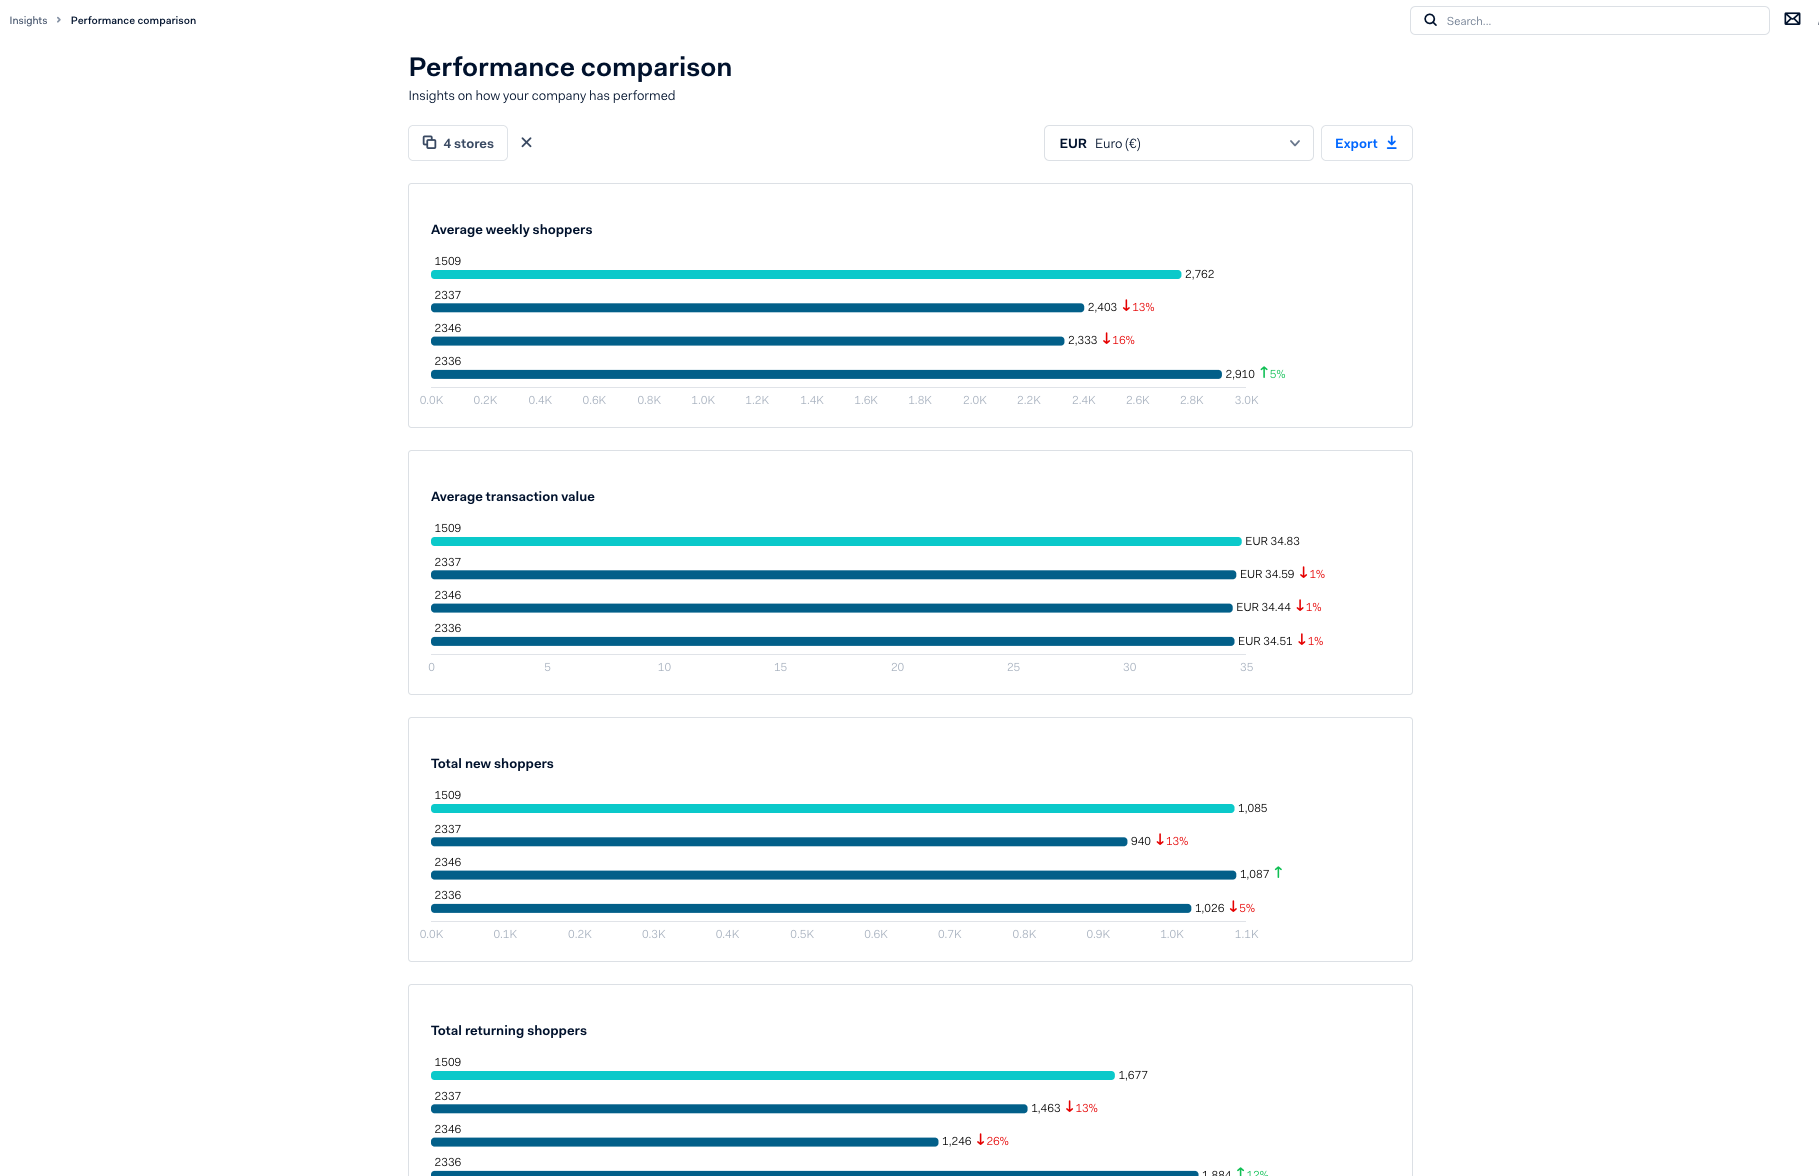
Performance comparison dashboard
The Performance comparison dashboard lets you put the performance of your organization into perspective. You can:
- Compare a single company or merchant account over multiple periods.
- Compare multiple accounts over a single period.
Starting January 12, 2026, the Performance comparison dashboard will be permanently shut down. If you have any questions, reach out to your Adyen contact.
Click the image to enlarge it.
Compare one account over multiple periods
By comparing the performance of an account in two or more periods, you can see if, for example, your store is doing better now than it was doing before. This can help you set and evaluate targets for revenue, customer acquisition, and customer retention.
To make the comparison:
- In your live Customer Area, select the account that you want to make the comparison for.
- Go to Insights > Performance comparison and select Compare.
- In the menu, select the Dates comparison.
- Add two or more periods to compare. Select Add comparison for an additional period.
- Optionally filter the result.
Compare multiple accounts over a single period
By comparing the performance of multiple accounts in the same period, you can create benchmarks for your organization. Or you can gather input for periodical market reviews where you want to show the performance of different countries/regions or stores. The comparison can serve as a starting point to have a discussion about best practices and possible areas of improvement.
To make the comparison:
- In your live Customer Area, go to Insights > Performance comparison and select Compare.
- In the menu, select the Country, Merchant account, or Store comparison.
- Select the period that you want to compare performance for.
- Select two or more countries/regions, accounts, or stores to compare. The one that you select first, is used as the baseline. All percentages show the deviation in the performance compared to this baseline.